By The Numbers
2018 in Numbers
- Total Workshops held in 2018 – 633
- Single session workshops – 485
- Program series workshops – 148
- Senior Participants Reached – 1,019
- Total Programming Partners 2018 – 33
- Fee for service clients – 11
- Teaching artist institute workshops – 2
- Temporary art exhibitions – 4
- Total AFTA teaching artists 2018 – 21
- New AFTA teaching artists 2018 – 4
Workshop Locations by Region
Montgomery County – 55%
Washington DC – 16%
Fairfax County, VA – 10%
Prince George’s County, MD – 9%
City of Arlington, VA – 4%
City of Alexandria, VA – 6%
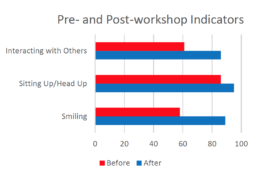
2018 Program Evaluation & Impact
Pre- and post-workshop outcomes allow us to see the direct impact of the Arts for the Aging programs on older adults living with mild to moderate aging-related physical and cognitive impairments. Data was collected from 633 multidisciplinary AFTA artist-led programs over a 12 month period in 2018 at 33 AFTA partner sites throughout Greater Washington DC.
- 91% overall participation, including showing appreciation and social connection
- 85% of participants sharing memories or imaginative stories
- 86% demonstrated appreciation for efforts and work of other participants
- 93% show appreciation to the teaching artist(s)
- 46% increase in positive emotional behavior from resurging feelings of joy and self-worth
- 38% increase in peer interaction
- 10% improvement in upright posture, with attention and strengthened confidence
Active group size: 18 plus 2 site-staff and 1-3 AFTA teaching artists.
2018 Target Population
Data collection for 632 workshops at 15 (53%) of AFTA partner sites (adult day centers, senior living communities, senior centers, community centers and nursing homes). These centers are recipients of financial aid from AFTA for programs and are located in Montgomery County and Prince Georges County, Maryland; City of Alexandria, Fairfax County and Arlington County, Virginia; and Wards 2, 3, and 4 in Washington DC.
Gender: Male 40%, Female 60%
Ages: Up to age 65 – 6%, Ages 66-74 – 24%, Ages 75-84 – 31%, Ages 85-94 – 25%, Ages 95+ – 4%
Racial/Ethnic Make-Up: Asian American – 22%, Black/African American – 18%, Caucasian American – 47%, Hispanic/Latino American – 12%, Other – 1%
Socio-economic: Private Pay – 30%, Commercially insured – 5%, Medicaid – 16%, Medicare – 23%, Subsidized by city/county – 35%, Veteran benefits – 2%, Other – 2%
Cognitive Impairment: Alzheimer’s disease (diagnosed) – 15%, Dementia (non-Alzheimer’s) – 26%, Vision impairment – 15%, Hearing impairment – 13%, History of CVA (stroke) – 10%, Developmental disability – 6%, Other (chronic illness, Parkinson’s, COPD) – 5%
Cognitive Ability: Alert and oriented – 46%, Mildly forgetful/confused – 26%, Moderate cognitive impairment – 21%, Severe cognitive impairment – 6%
Physical Ability: Independent – 64%, Uses cane or walker – 25%, Uses wheelchair – 11%, Needs bed care – 0%
General Ability: Needs verbal cues – 36%, Needs hands-on assistance – 20%
Veteran: 10%